Recently I was in a discussion about how various applications or websites deliver charts to their users. for mobile there were some suggestions about developing native apps on Android or Iphone. There is potential to use xamarin to create these apps with a single project. But as I have been reading recently about the Progressive Web App (PWA) technology I was convinced that the same could be done with a PWA allowing a shared base of assets across desktop, tablet or mobile regardless of OS. I thought, in my own time, how hard could it be to create a proof of concept charting app showing how it could work. Below is how I created the chart app you can see here
Progressive Web Apps are a combination of technologies. Custom Elements, HTML Imports, Templates, Service Workers, Web App Manifest.
Service Workers allow you to have full control over network requests and the caching of content. In particular they allow you to have websites that work offline. This is great for Mobile Apps where connectivity may not always be great and can have performance benefits in general where you can choose your caching strategy such as cache first, network first or cache fallback.
With my proof of concept I wanted to have a cache first aproach to static assets and have a network first with a cache fallback for chart data. This would suit the scenario where the data of a chart is regularly being updated.
Custom Elements were used to encapsulate the chart which Implemented in D3. The encapsulation is very helpful in being able to style the chart without other css impacting the style of the chart. This will make them perfect for embedding in other content. For example inserting them in a section of a blog article.
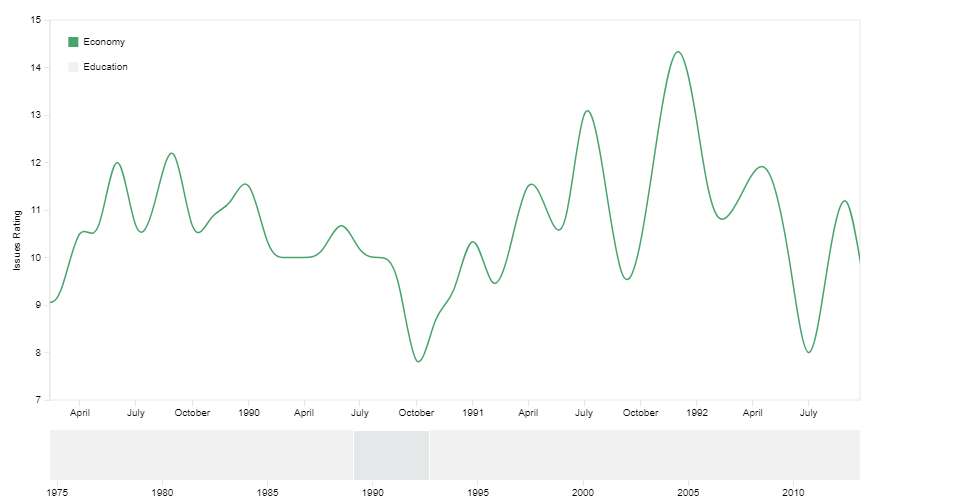
The chart I created uses some basic D3 elements to create the chart and the context area as an SVG. The reason I wanted to use D3 to create an SVG is that I can inspect the created SVG to retrieve the equivalent text and use this to export to the user so that they can use the SVG as they will.
Getting the SVG text is simple to do and can be done by using the following code.
var svg_element = svgRoot.node();
var s = new XMLSerializer().serializeToString(svg_element)
svgRoot is a D3 container of a DOM node so we use the .node() method to get the dom element.
We then use an XMLSerializer to convert our SVG chart to text.
This is the basis of how we allow a user to then download the chart they are viewing.
To allow a user to download this I perform the following steps if a user clicks the export to SVG button.
The end result of this is that the browser creates and downloads the chart without the need to contact the server.
For download to PNG there is a slightly more complicated set of steps
The end result of this is the same image but as a png.
The end result of all the above is a Web Application that can work Offline and across Android, Desktop, Tablet (and soon to also be on safari broswers). On For Android in particular the user will see the full App experiance. That can create fully customisable charts and download them to SVG or PNG exactly as the user sees them in a pretty performant manner.
On the downside, this is not supported by IE so may not be suitable in certain commercial settings. Given that the end of enterprise support for windows 7 is in 2020 we may find that there is a big move to Microsoft Edge. Microsoft have recent been pushing towards using progressive web apps in a big way in Windows 10 and the Edge browser. So this downside may not be what is now in 2 years time.
Also on the downside Apple has yet to implement the service worker functionality that means the offline experiance is not yet available on iPhones or iPads. This though is due to change soon as service workers are in active development
All in all our proof of concept is a success in that it shows a great support for offline Web App capabliitiles from the different plataforms if not now, then in the the near future.
The ability to provide self contained, downloadable, fully customizable and performant charts completes the success.

